
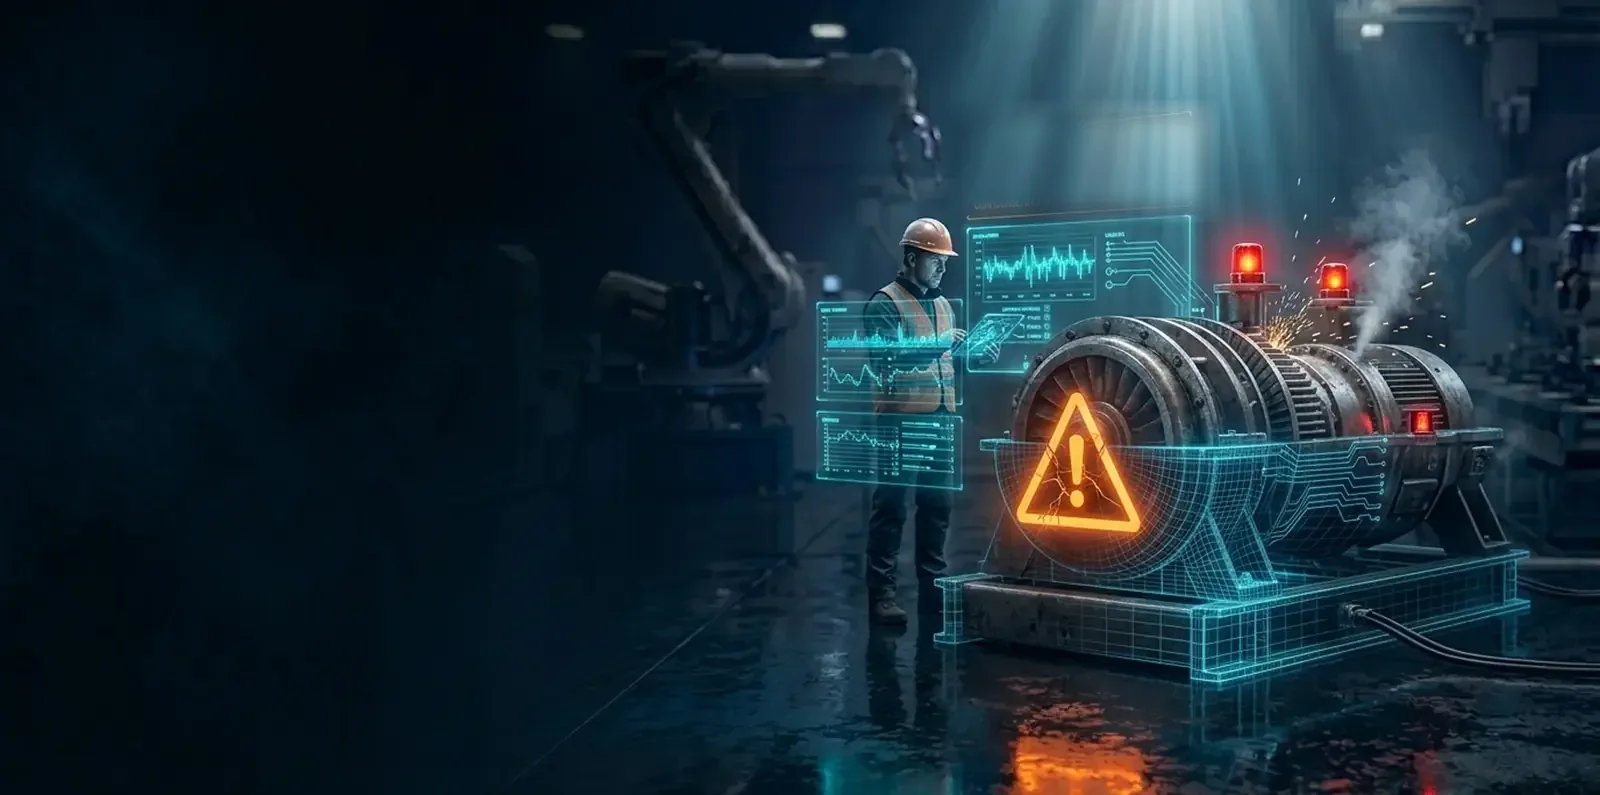
Industrial AI you can check
Predict the failure. Explain the cause. Prove every prediction.
Ryedore is industrial AI for predictive maintenance that you can check: it tells you why a machine is failing, how long you have, and what to do — and shows its work.
- 1/5
Reads what you already collect
Historian, SCADA and CMMS — read‑only. No sensors sold, nothing replaced.
- 2/5
Learns each asset's own normal
Warm‑started by cross‑industry learning, then tuned on your assets and your confirmed labels.
- 3/5
Predicts — physics‑checked
Remaining life, anomalies and causes, validated against the governing equations before they reach you.
- 4/5
Proves every prediction
A reasoning trace behind each answer; gates, signed benchmarks and a signed residency attestation behind the system.
- 5/5
Acts in your CMMS
A work‑order draft into the system you already run — after a person approves it.
And through all five: the model and your data never leave your fence.
Five kinds of people land here. Each has a three‑step path.
Every path ends at something you can check.
Plant & reliability engineers
What it actually says about a machine — and whether you can argue with it.
Show the three steps →The three steps:
Operations & maintenance leaders
Fewer surprises, and a number with a range instead of a red light.
Show the three steps →The three steps:
Security, IT & OT
Where the data goes (nowhere), and which certifications are real.
Show the three steps →The three steps:
Buyers & procurement
Published prices, no pilots, and proof before any conversation.
Show the three steps →The three steps:
Investors
A lab and a platform you can check — and what the round builds.
Show the three steps →The three steps:
An alarm says something changed. A diagnosis says why.
Same pump, same signal. Left: what a monitoring platform shows. Right: what Ryedore shows.
swipe → to see the whole diagram
Not “trust us.” Verify us.
Three things you can check today — before talking to anyone.
We test on datasets anyone can download, publish the results — including where we lose — and sign them so you can re‑run the test.
In plain terms →In plain terms
In plain terms: on NASA’s engine data our remaining‑life estimate is typically within about 18 flight cycles, and our anomaly detector ranks a real failure above normal operation 99 times in 100.
Every new version must beat the current one on every task before it is allowed to run. Worse on even one? Blocked — and we show the log.
In plain terms →In plain terms
In plain terms: the model you run tomorrow is never worse than the one you run today.
Not a score — the chain of causes, the evidence, the confidence, and a recommendation you can question.
- Vibration rising for 11 days — accelerating.
- Cause: coupling misaligned → bearing wear → vibration.
- Remaining life ≈ 6 days (4–9). Re‑align; replace bearing at next stop. Don’t swap the bearing alone.
- Confidence 89 % · physics check passed · illustrative.
We publish our losses too. Benchmarks — wins and losses, signed. Certifications — aligned, in progress, or planned. Scenarios — labelled illustrative until customers attribute them. Where we are still behind →
Not a mock-up. The product, answering.
Real screens, captured from the platform running on demonstration data. The teal notes point at what matters on each one.
A reasoning trace, start to finish
From a sensor deviation to a recommended action — the seven steps animated in one minute. Served from this site; nothing loads from anywhere else.
Every screen answers a question a person on the plant actually asks — see how it works →
See the platform in action
From hundreds of alerts to what actually matters — the Ryedore overview.
Keep it. Ryedore is the intelligence layer on top.
To be explicit: Ryedore is not an IoT platform — it sells no sensors, collects no data, and replaces nothing. Your dashboards tell you that something changed; Ryedore sits on top and adds why, how long, and what to do — with proof, from the data you already collect.
swipe → to see the whole diagram
The way an experienced engineer thinks — and it shows its work
It perceives thousands of signals. It remembers every failure it has seen. It reasons about the cause. And it can’t quietly get worse.
Built on our own industrial multi‑task encoder — a shared cross‑industry representation — and improving by design: the platform proposes its own experiments, and a gate decides what ships.
How it works, in depth →
Four beats
- 1 · Perceives
Thousands of signals at once, and the subtle shifts a seasoned operator would notice.
Show the example →Example
for example · Truck‑147 runs 2.4 °C above the fleet average and its hydraulic pressure variance is climbing — no threshold has tripped yet.
- 2 · Remembers
Every failure, near‑miss and confirmed root cause — kept, weighted, never lost to a retrain.
Show the example →Example
for example · For that truck it recalled four similar patterns from other fleets — early transmission wear — and said so.
- 3 · Reasons
Eight kinds of reasoning, including the causal chain — not a correlation score.
Show the example →Example
for example · Pump P‑204: the vibration is the symptom; the cause is a misaligned coupling wearing the bearing — so swapping the bearing alone won’t hold.
- 4 · Can’t get worse
A new model version must beat the current one on every task before it may serve.
Show the example →Example
for example · The log of what was blocked and admitted is on the Verify page.
One agent acts — with your approval. One experiments — and never touches the plant.

“Why is Reactor R‑201 trending toward an alarm, and what should I do?”
What it does, step by step →Step by step
- Plans the investigation and runs the right tools on your live data
- Validates against physics and standards, answers with a trace and a confidence
- Proposes an action; six checks and a human must approve before anything happens
Never acts on its own. Never invents an answer it can’t ground.
Meet Ryekronix →
“Would a ceramic seal on the CNC spindle last longer?”
What it does, step by step →Step by step
- Six specialists design a controlled trial — baseline versus intervention
- Runs it on a physics twin and reports which physics tier it used
- Hands you the statistics — p‑value, effect size, confidence interval — with provenance
Never changes a set‑point. Never cites a number it didn’t measure.
Meet the Lab →Eight things the platform does that a dashboard can’t
Described by what it does for you. Each links to the page that proves it.
Our own industrial model
Built in‑house, learned across industries — no third‑party model anywhere in the stack.
See it →Memory that never forgets a failure
Every confirmed root cause and near‑miss is kept — weighted by how much it mattered.
See it →Physics‑ and standards‑checked answers
Every recommendation is tested against physical limits and the relevant standards first.
See it →Ranges, not point guesses
Remaining life and what‑if come as calibrated ranges — and the calibration is signed.
See it →An agent that asks first
Ryekronix plans and proposes — six checks and a human approve before anything happens.
See it →Experiments on a virtual copy
Baseline‑versus‑intervention trials on a physics twin — it never touches the plant.
See it →A model that can’t quietly get worse
Named gates block any version that regresses on any task; every promotion is logged, signed.
See it →On your hardware, attested
On‑premises or air‑gapped; residency is fail‑closed and recorded in a signed attestation.
See it →The same explanation — for your industry
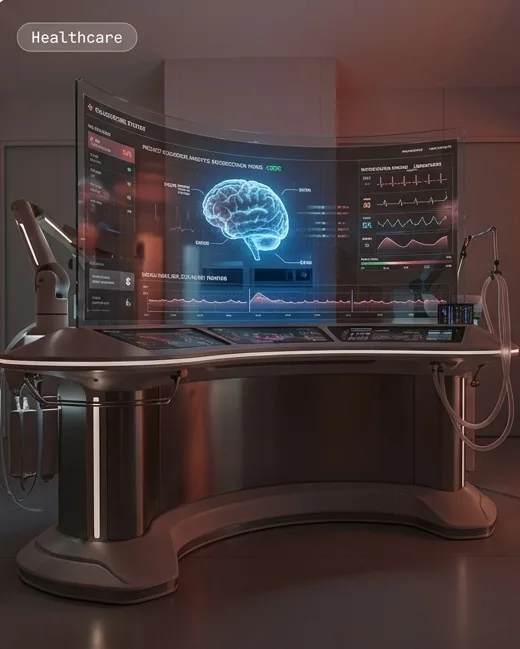
Every detection answers five questions: where, what signal, why, what to do, what happened. Choose a sector, including life‑critical and hazardous ones, and read the same five answers for its equipment. illustrative
- Setting
- A 400‑bed hospital; a patient two days after surgery; no single vital sign has crossed an alarm threshold.
- Signal
- Heart rate +12 bpm over six hours, temperature +0.4 °C, respiratory rate +3 — together, not separately.
- Why
- The multi‑parameter drift matches early sepsis patterns seen before; confidence 91 %.
- Response
- Care team alerted eight hours before standard criteria would have fired; blood cultures drawn; a clinician decides — the AI recommends, it never treats.
- Outcome
- Antibiotics started earlier than protocol would have triggered; the trace shows which signals drove the call.

On your hardware. Your data never leaves — and the model still improves.
Ryedore’s shared cross‑industry model is trained centrally on public, permissively‑licensed data; the copy on your hardware learns from your labels. Improvements arrive as signed, gated promotions; nothing travels the other way.
A lab and a platform you can check — and what the round builds next.
Investor overview →
See a real prediction traced end‑to‑end.
On your data or ours — with the reasoning, the physics check, and the proof link.